REAL ESTATE REVIEW
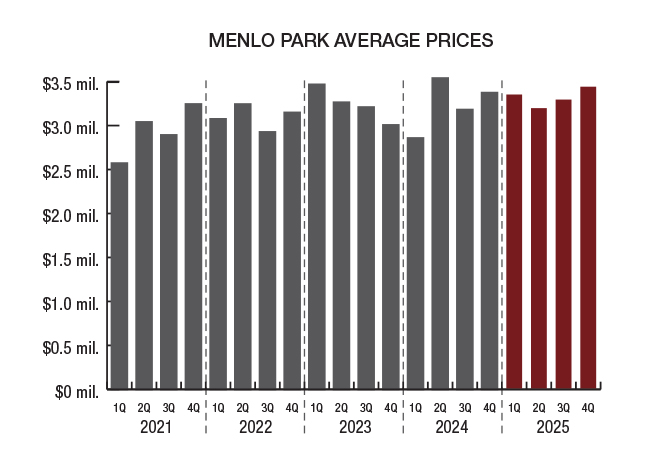
The average sale price in Menlo Park reached another record high of $3,299,583. This represents a 1% increase compared to 2024 (and includes both single-family homes and condos/townhomes). Quarterly average prices varied but each was over $3.1 million. The first quarter was $3,344,411; the second quarter then dipped to $3,189,008, then rose to $3,287,252 in the third quarter, and then back up to the high in the fourth quarter of $3,432,658.
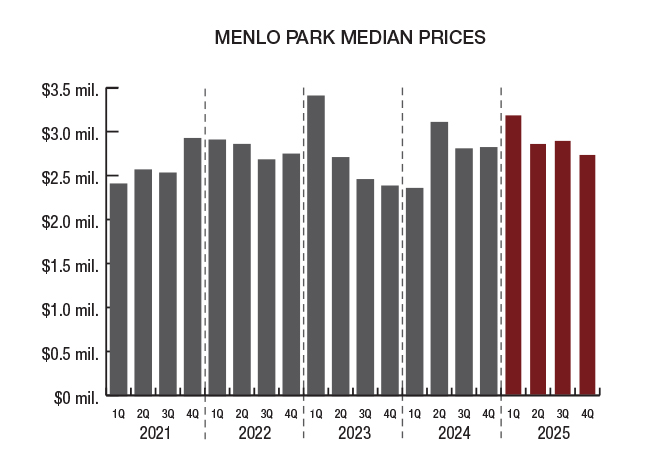
In 2025, the median sale price in Menlo Park increased 5% to $2,881,500, a new record high. The median price was the highest in the first quarter at $3,175,000, then dropped to $2,850,000 in the second quarter, then to $2,885,000 in the third quarter, and ended at $2,725,000 in the fourth quarter.
The highest end of the market was strong with 3 homes sold for more than $10 million. There were 36 homes that sold for $6 million or more, the same as in the previous year. Keep in mind that any Menlo Park properties sold off-MLS are not part of this review.
There were 192 homes, or 51%, sold for more than list price in Menlo Park, compared to 52% in 2024. There were 51 homes, or 13%, that sold at list price and 135 homes, or 36%, that sold for less than list price.
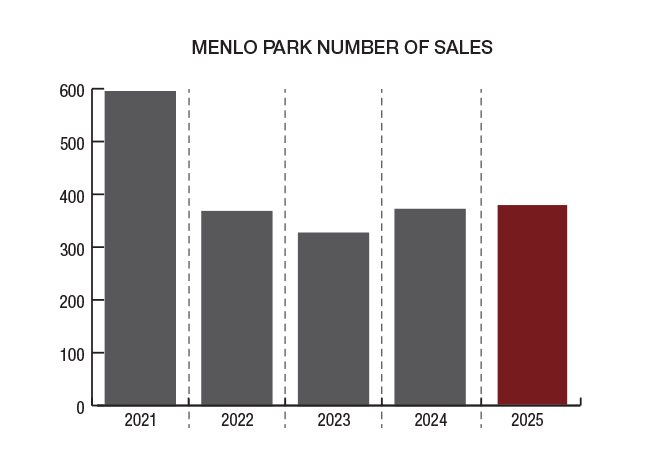
The number of closed escrows in Menlo Park, including single-family homes and townhomes/condos, was 378 compared to 371 in 2024. This represents a 2% increase from 2024. There were 53 closed escrows in the first quarter, 121 in the second quarter, 114 in the third quarter, and then 91 sales in the fourth quarter.
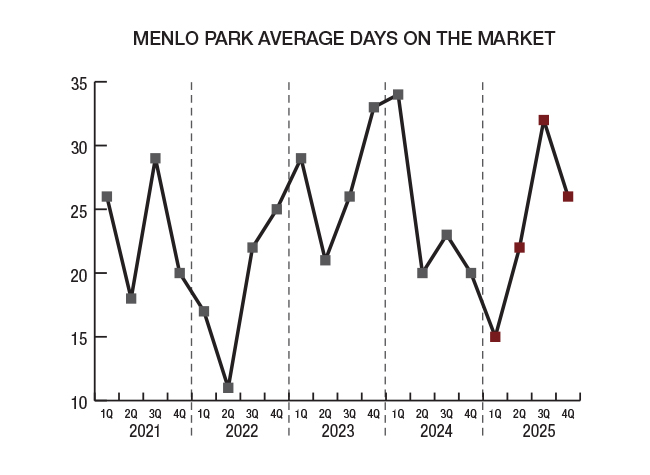
Homes sold on average in 25 days on market, an increase of 25% compared to 2024. The median days on market was 11 compared to 12 in 2024. Pricing was still key to how long a home was on the market. This direct correlation is seen with homes that sold for list price or more, which were on the market an average of just 13 days; homes that sold for less than list price were on the market for an average of 47 days.


