REAL ESTATE REVIEW
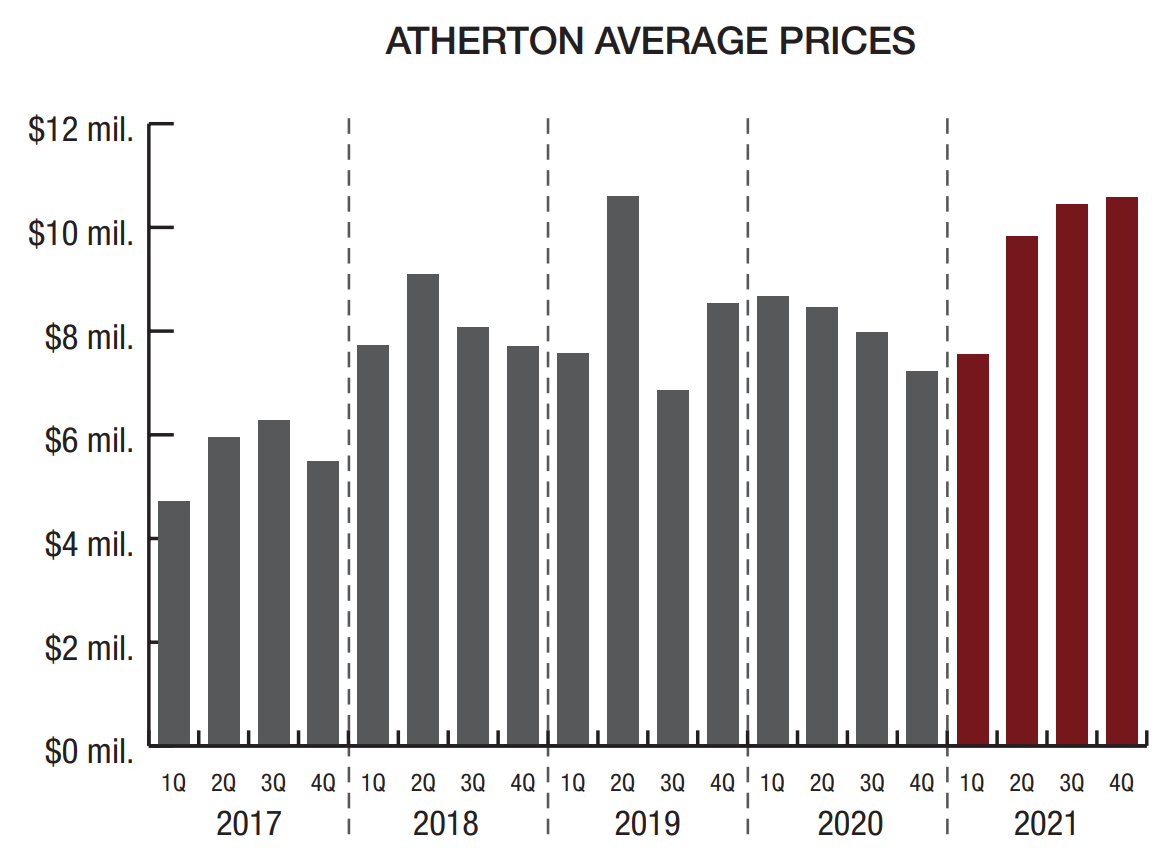
The average price reached a dramatic new high crossing over the $9 million mark for the first time. At $9,723,768, this represents a 24% increase compared to 2020, the first year of the pandemic, in which we saw a decline of 10%. Keep in mind that any properties sold in Atherton off-market are not part of this review.
Quarterly prices steadily increased in 2021 as shown in the quarterly average chart. The first quarter was the lowest at $7,525,947, then increasing to $8,300,000 in the second quarter, $8,650,000 in the third quarter, and the highest level in the fourth quarter at $10,542,939. This was just slightly below the record high quarterly price reached in the second quarter of 2019 at $10,606,955.
The highest end of the market was particularly strong with 35 homes sold for more than $10 million on the MLS, compared to 23 in 2020 and 19 in 2019. The highest priced sale on the MLS was $32,000,000; the highest price on the MLS in 2020 was $35,200,000. The fourth quarter had 13 sales for more than $10 million. This follows the third quarter with 8 sales over $10 million, the second quarter with 11, and the first quarter with just 3. There was also one sale at $10 million in the fourth quarter.
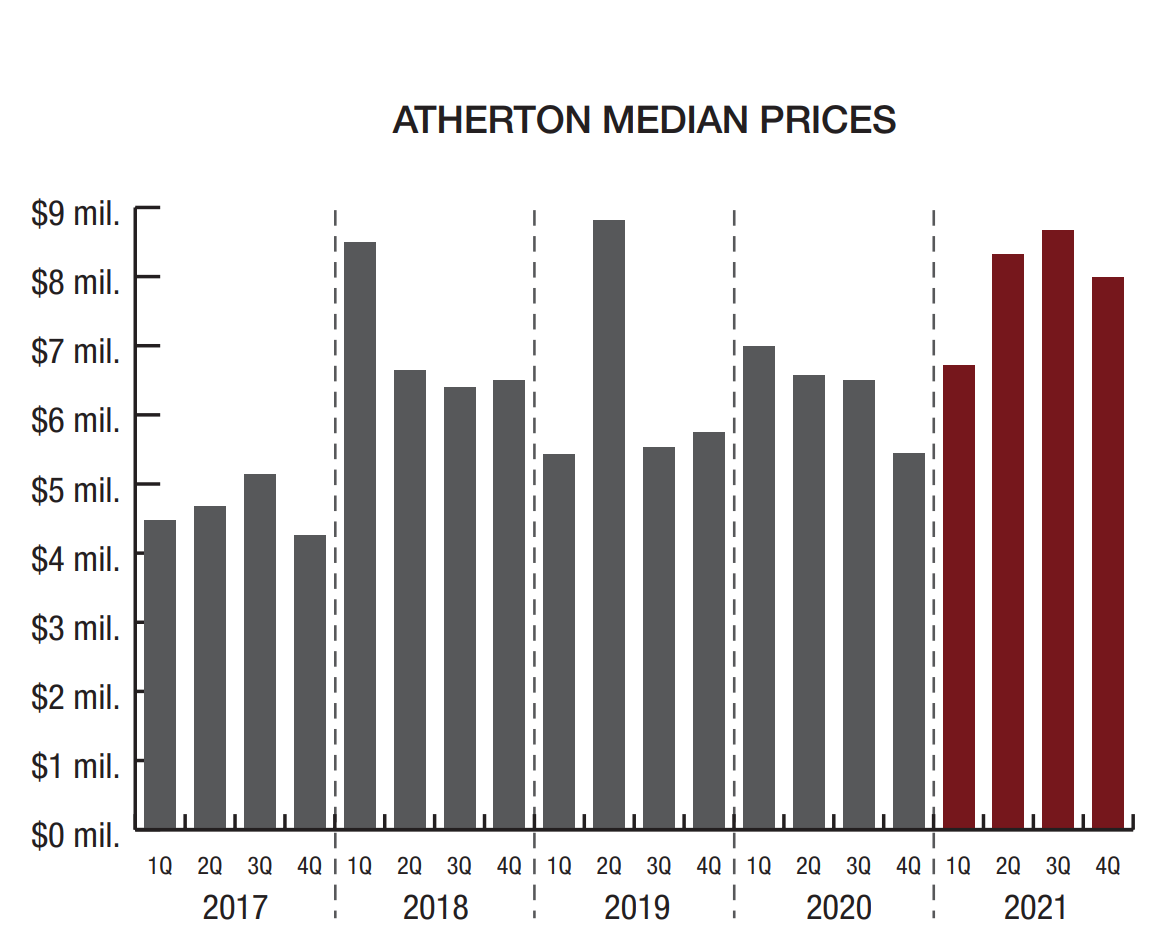
The median price of an Atherton home in 2021 increased 28% to $7,969,000 – yet another dramatic record high. This compared to a median price of $6,350,000 in 2020, $6,000,000 in 2019, and $6,650,000 in 2018, the previous record high.
Fewer homes sold over list price than in years past but there were still 28, or 27%. This compares to 21% in 2020. There were 13 homes, or 12.6%, that sold at list price and 62 homes, or 60%, that sold for less than list price.
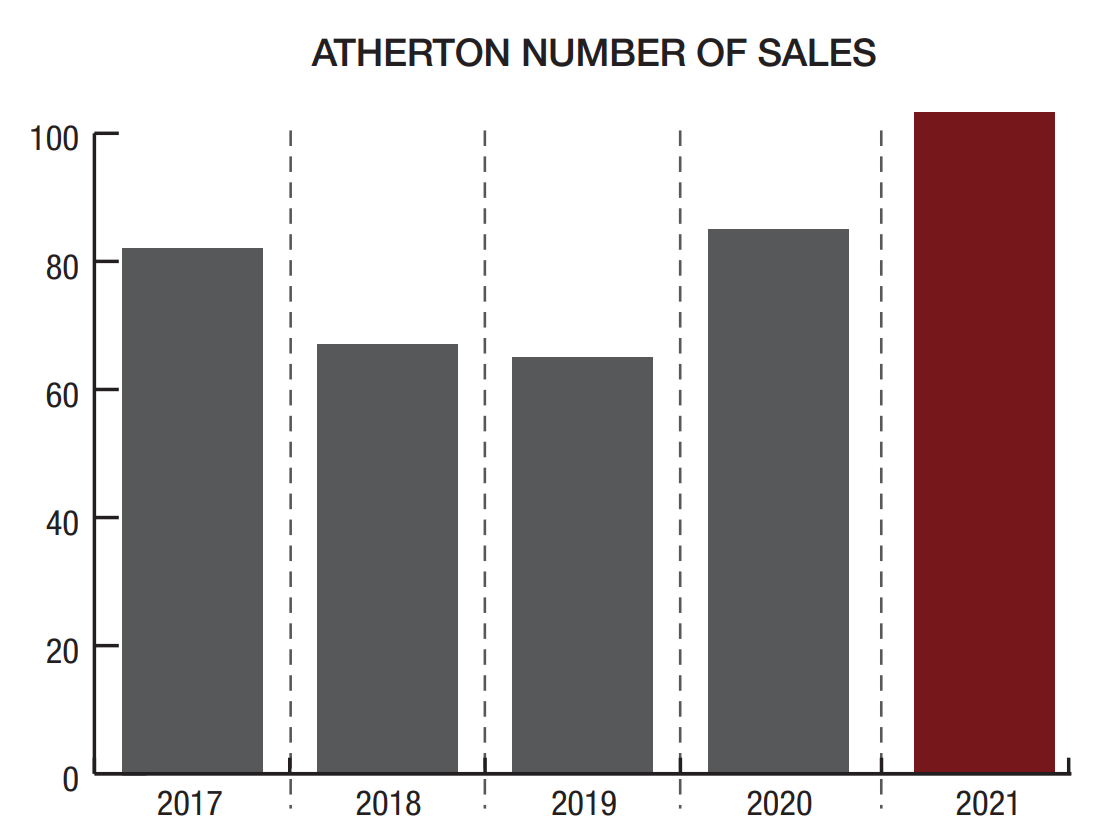
In 2021, the total number of closed escrows in Atherton (per the Multiple Listing Service) totaled 103, the highest number since 2013. There were 19 homes sold in the first quarter, 33 in the second quarter, 20 in the third quarter, and 31 in the fourth quarter.
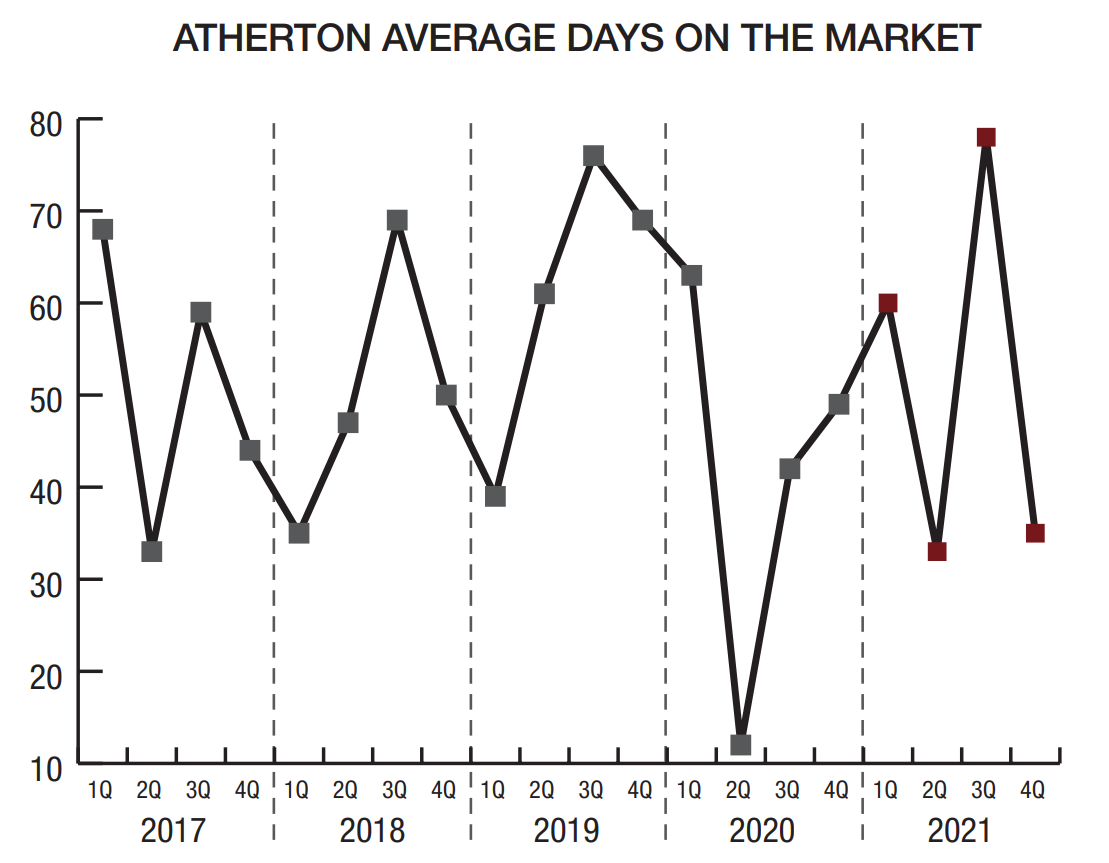
The average days on market, at 47, was higher than it was in 2020 when it was 44, but that was a year in which not all days were accounted for in the early part of the pandemic. At an average of 47 days, and excluding 2020, this was the lowest number of days per records dating back to 2005. Pricing was still key to how long a home was on the market. This direct correlation is seen with homes that sold for list price or more, which were on the market an average of just 10 days; homes that sold for less than list price were on the market for an average of 72 days.


