Communities | Atherton
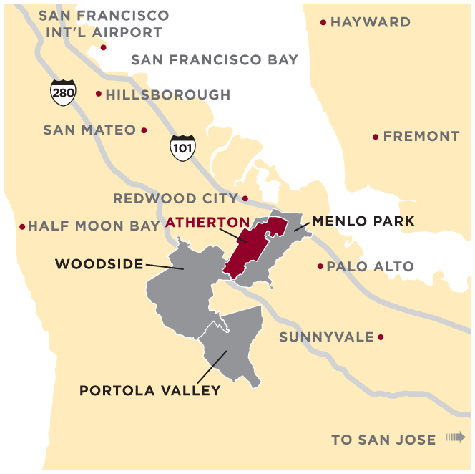
About the Community of Atherton...
Atherton is named for Faxon Dean Atherton, a wealthy trader from Chile, who purchased 640 acres and established the first large estate in the area. The completion of the railroad in 1863 attracted other prosperous citizens of San Francisco, hoping to escape the summer fog. The Town was incorporated in 1923, and adopted stringent zoning regulations.

Atherton Highlights
| Population: | 6,823 |
| Elevation: | 59′ |
| Date incorporated: | 1923 |
| Number of homes: | 2,539 |
| Lowest sale price 2025: | $2,000,000 |
| Highest sale price 2025: | $45,500,000 |
| Average sale price 2025: | $11,690,322 |
As a result, Atherton retains the pastoral atmosphere enjoyed by those nineteenth century residents, with majority of properties in this exclusive zip code exceeding an acre. No sidewalks, an abundance of heritage oaks, and a ban on commerce, plus equal access to San Francisco and San Jose have made Atherton one of the most expensive addresses in the country. Atherton has been consistently ranked by a national magazine as one of the top five most affluent cities in the country.
2025 in Review | Atherton
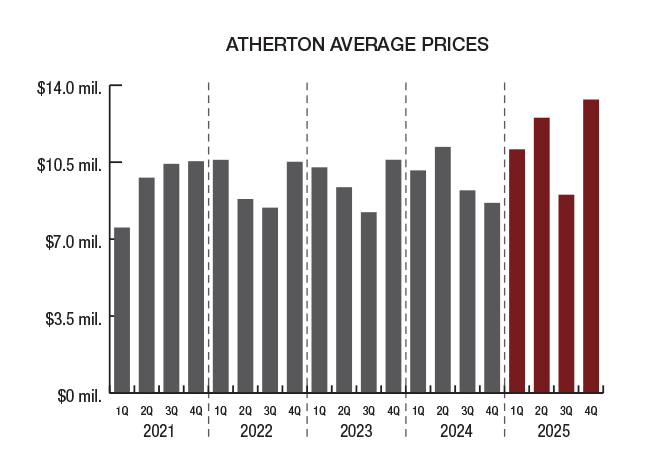
The average price increased 20%, to almost $12 million far surpassing the $9 million range for the past 4 years. Keep in mind that any properties sold in Atherton off-MLS are not part of this review. Throughout the year, the highest average price was in the fourth quarter at $13,314,087; in the first quarter the average price was $11,047,453, then in the second quarter the average was $12,486,361, and then it fell in the third quarter to $8,983,706
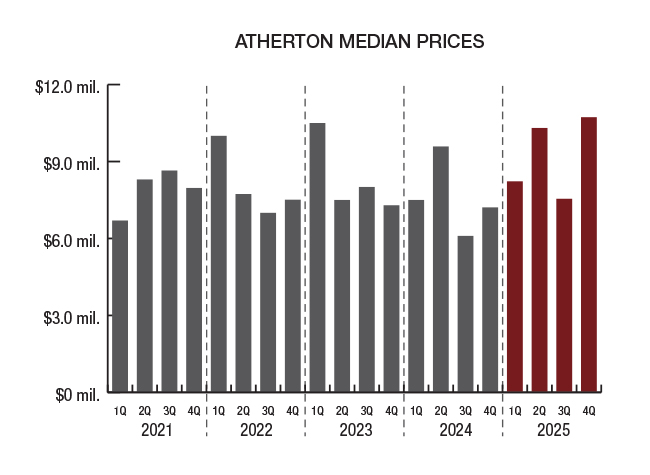
Median prices followed suit by quarter, as seen in the graph. The highest median price was in the fourth quarter at $10,700,000 followed by the second quarter, which was $10,280,000. Prices started in the first quarter with a median of $8,200,000, and then fell to $7,520,000 in the third quarter. Year-over-year, the median price was up 25% compared to 2024.
The highest end of the market was strong with 37 homes sold for $10 million or more on the MLS; this compares to 31 homes in 2024 and 2023, 29 in 2022, and 35 in 2021. The highest priced sale on the MLS was $45,500,000. Both the second and fourth quarters had 13 sales in this category. This was followed by the first quarter with 7 sales and the third quarter with 4 sales for $10 million or more.
The number of homes sold over list price increased significantly. There were 32 homes, or 41%, that sold over list price compared to 28% in 2024, 13% in 2023, and 41%, in 2022. There were also 9 homes that sold at list price and 37 homes that sold for less than list price.
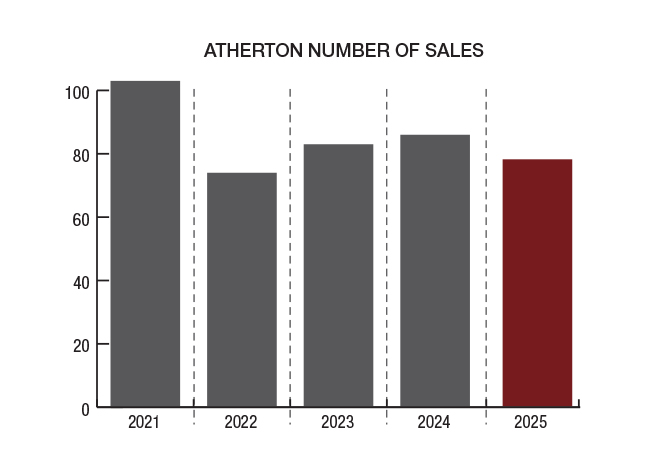
In 2024, the total number of closed escrows in Atherton (per the Multiple Listing Service) totaled 78, down 7% from the 86 sales in 2024. There were 15 homes sold in the first quarter, 23 in the second quarter, 17 in the third quarter, and 23 in the fourth quarter
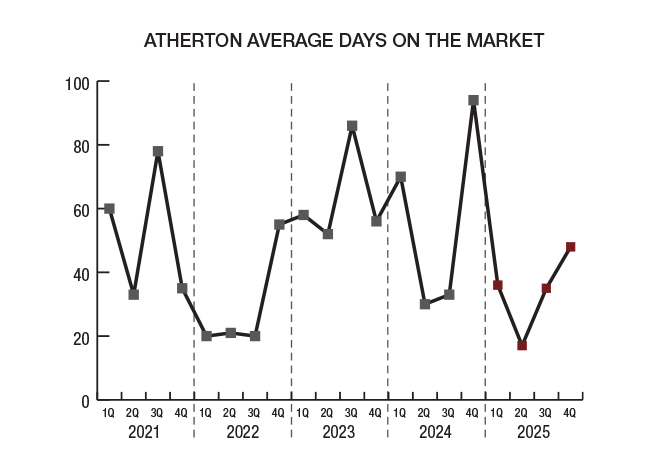
The average days on market, at 34, was far less than it was in 2024 when it was 55. In 2022, the average days on market was just 27 days, which was a record low. Pricing was still key to how long a home was on the market. This direct correlation is seen with homes that sold for list price or more, which were on the market an average of 14 days; homes that sold for less than list price were on the market for an average of 56 days.
Important Atherton Phone Numbers
School Websites and Phone Numbers
| Las Lomitas School District | 650•854•2880 |
| Menlo Park School District | 650•321•7140 |
| Redwood City Elementary School Dist. | 650•423•2200 |
| Sequoia Union High School District | 650•369•1411 |
Communities | Menlo Park
About the Community of Menlo Park...
Though Menlo Park has its share of luxury properties, its character remains essentially modest. Charming, custom homes on pretty lots line quiet streets. The downtown business district offers a picture of suburban life as shoppers stroll beneath the trees, stopping for a sidewalk coffee, or an ice cream cone. Originally growing up around the train station, built in 1866 and a registered historic landmark, the City of Menlo Park was incorporated in 1927.
Menlo Park Highlights
| Population: | 31,690 |
| Elevation: | 72′ |
| Date incorporated: | 1927 |
| Number of homes: | 11,347 |
| Lowest sale price 2025: | $665,000 |
| Highest sale price 2025: | $10,500,000 |
| Average sale price 2025: | $3,299,583 |
The name was taken from the sign “Menlo Park, 1854” which was painted on the gate erected by two early settlers who emigrated from Menlough in Ireland. Today, the excellent school system and the strong sense of community have made Menlo Park a highly desirable place to work and live. Menlo Park is also headquarters for much of the venture capital money fueling the Silicon Valley economy.
2025 in Review | Menlo Park
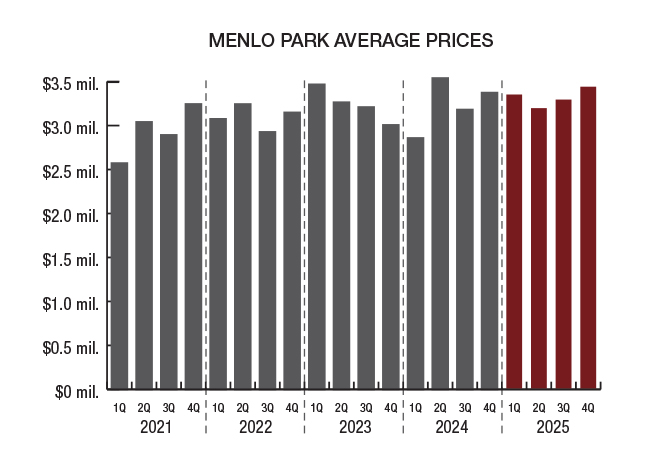
The average sale price in Menlo Park reached another record high of $3,299,583. This represents a 1% increase compared to 2024 (and includes both single-family homes and condos/townhomes). Quarterly average prices varied but each was over $3.1 million. The first quarter was $3,344,411; the second quarter then dipped to $3,189,008, then rose to $3,287,252 in the third quarter, and then back up to the high in the fourth quarter of $3,432,658.
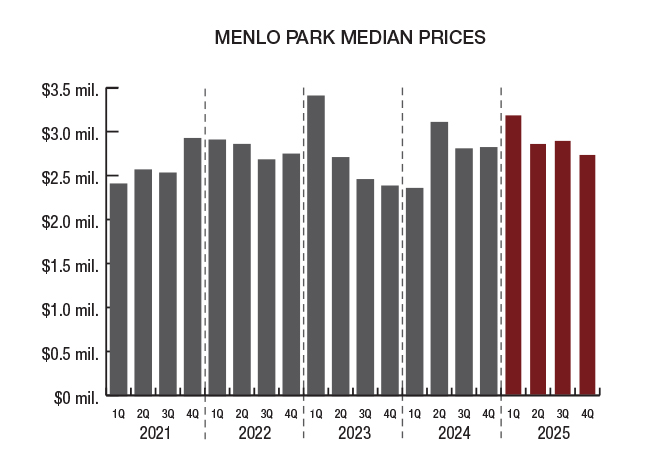
In 2025, the median sale price in Menlo Park increased 5% to $2,881,500, a new record high. The median price was the highest in the first quarter at $3,175,000, then dropped to $2,850,000 in the second quarter, then to $2,885,000 in the third quarter, and ended at $2,725,000 in the fourth quarter.
The highest end of the market was strong with 3 homes sold for more than $10 million. There were 36 homes that sold for $6 million or more, the same as in the previous year. Keep in mind that any Menlo Park properties sold off-MLS are not part of this review.
There were 192 homes, or 51%, sold for more than list price in Menlo Park, compared to 52% in 2024. There were 51 homes, or 13%, that sold at list price and 135 homes, or 36%, that sold for less than list price.
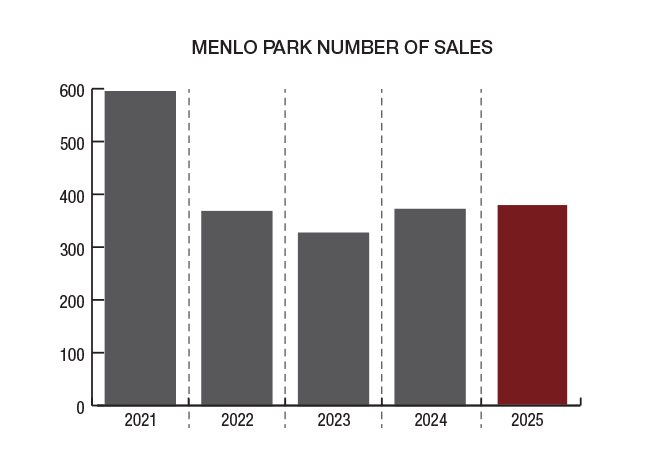
The number of closed escrows in Menlo Park, including single-family homes and townhomes/condos, was 378 compared to 371 in 2024. This represents a 2% increase from 2024. There were 53 closed escrows in the first quarter, 121 in the second quarter, 114 in the third quarter, and then 91 sales in the fourth quarter.
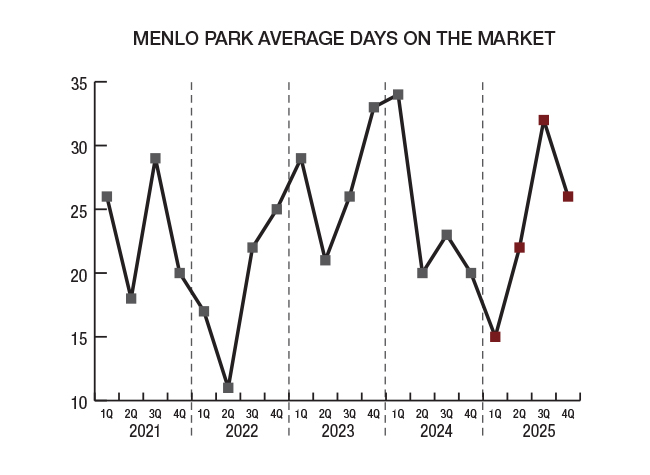
Homes sold on average in 25 days on market, an increase of 25% compared to 2024. The median days on market was 11 compared to 12 in 2024. Pricing was still key to how long a home was on the market. This direct correlation is seen with homes that sold for list price or more, which were on the market an average of just 13 days; homes that sold for less than list price were on the market for an average of 47 days.
Important Menlo Park Phone Numbers
| Police Non-emergency | 650•330•6300 |
| Fire Non-emergency | 650•688•8400 |
| Building Permits | 650•330•6704 |
| Caltrain | 800•660•4287 |
| City Office | 650•330•6620 |
| Library | 650•330•2500 |
| Post Office | 650•323-2701 |
| Voter Registration | 800•345•8683 |
School Websites and Phone Numbers
| Las Lomitas School District | 650•854•2880 |
| Menlo Park School District | 650•321•7140 |
| Sequoia Union High School District | 650•369•1411 |
Communities | Portola Valley
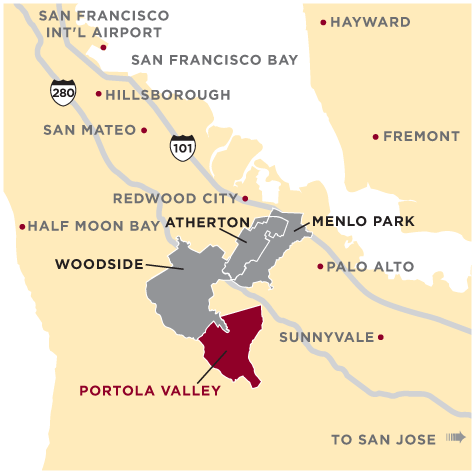
About the Community of Portola Valley...
In Portola Valley, named for the Spanish explorer Gaspar de Portola, oak-studded meadows open onto vistas of San Francisco Bay and the unspoiled Coast Range. The area’s first settlement was the logging town of Searsville, founded in the nineteenth century. Farming and cattle ranching were the primary industries until the 1920’s.
Portola Valley Highlights
| Population: | 4,123 |
| Elevation: | 455′ |
| Date incorporated: | 1964 |
| Number of homes: | 2,347 |
| Lowest sale price 2025: | $1,505,000 |
| Highest sale price 2025: | $56,000,000 |
| Average sale price 2025: | $5,573,720 |
After World War II, the valley began to be developed, typically with modest, ranch-style homes on large lots. Long a preferred address of Stanford University professors, Portola Valley has made well-staffed, well-equipped public schools a top priority. The town was incorporated in 1964, with the goal of maintaining the rural ambience of the community, and preserving open space. Today, Portola Valley is known for its unpretentious lifestyle and small-town atmosphere.
2025 in Review | Portola Valley
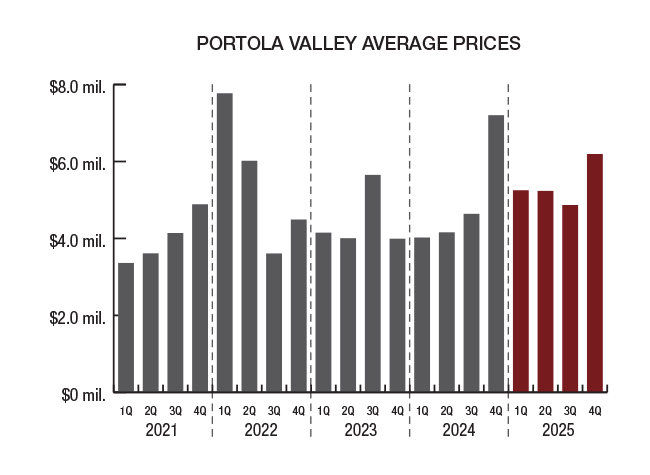
The average sale price in Portola Valley was a record high at $5,573,720. This represents a 13% increase 16 compared to 2024, and only the second time it has exceeded $5 million. As the year went on, the average price fluctuated each quarter and then escalated at the end of the year. In the first quarter it was $5,252,077, in the second quarter it was $5,236,333, in the third quarter it was $4,868,889, and then it reached its high of $6,194,458 in the fourth quarter with the sale of one home for $56 million
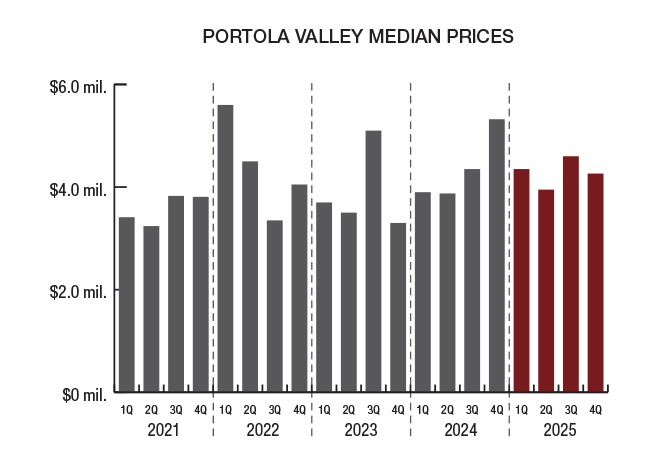
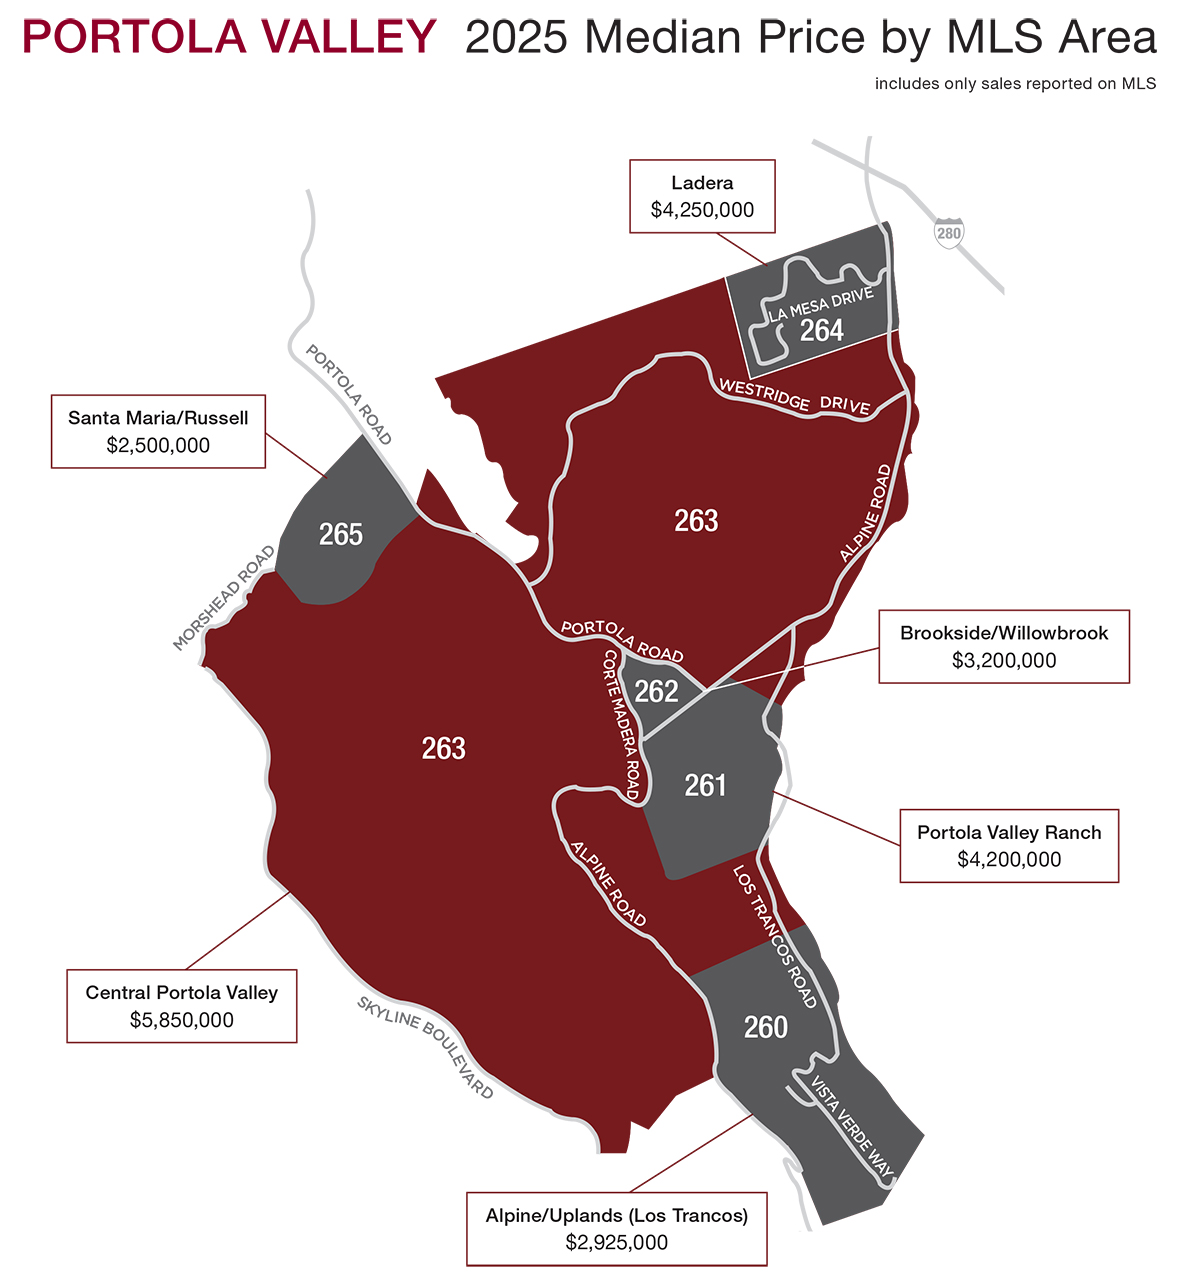
The median sale price of $4,250,000 represented a 4% increase compared to 2024, and was also a record high. The median price was $4,350,000 in the first quarter, then dropped to $3,950,000 in the second quarter, increased to its highest at $4,600,000 in the third quarter, and then dropped again to $4,262,500 in the fourth quarter.
There were 3 sales for more than $12 million on the MLS, including one at $25 million and one at $56 million. There were 12 homes that sold for $7 million or more, the same number as in 2024
There were 37 homes, or 49%, that sold for more than list price. This compares to 29 in 2024. 9 homes sold for list price and 30 homes, or 39%, sold for less than list price.
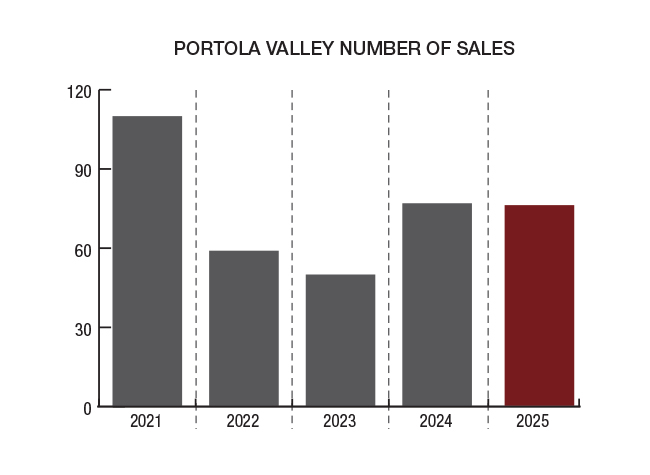
The number of closed escrows in Portola Valley dropped by 1 to 76 sales in 2025 compared to 77 in 2024. There were 13 sales in the first quarter, 24 sales in the second quarter, 9 sales in the third quarter, and 30 sales in the fourth quarter. Keep in mind that any Portola Valley properties sold off-MLS are not part of this review.
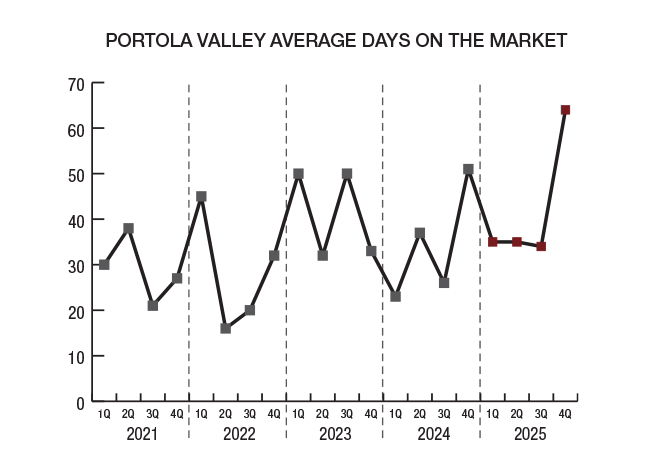
The average days on market, at 46, was a 39% increase compared to 2024. Pricing was still key to how long a home was on the market. This direct correlation is seen with homes that sold for list price or more, which were on the market an average of 15 days; homes that sold for less than list price were on the market for an average of 94 days.
Important Portola Valley Phone Numbers
| Police Non-emergency | 650•363•4911 |
| Fire Non-emergency | 650•851•1594 |
| Building/Planning | 650•851•1700 |
| Caltrain | 800•660•4287 |
| City Office | 650•851•1700 |
| Library | 650•851•0560 |
| Post Office | 650•851•2560 |
| Voter Registration | 800•345•8683 |
School Websites and Phone Numbers
| Portola Valley School District | 650•851•1777 |
| Sequoia Union High School District | 650•369•1411 |
Communities | Woodside
About the Community of Woodside...
Woodside, as the name might suggest, began as a logging town centered around the Woodside Store. Beginning in the 1830’s, the local sawmills supplied the first growth redwood lumber used to build much of old San Francisco. As early as 1852, a regular stagecoach ran between San Francisco and Woodside, which by that time had developed into a community of farms, cattle ranches and vineyards.
Woodside Highlights
| Population: | 5,037 |
| Elevation: | 379′ |
| Date incorporated: | 1956 |
| Number of homes: | 2,615 |
| Lowest sale price 2025: | $685,000 |
| Highest sale price 2025: | $85,000,000 |
| Average sale price 2025: | $5,863,539 |
The forested seclusion of the area attracted well-to-do San Franciscans, who began constructing often-elaborate county estates, some of which still exist. Woodside was incorporated in 1956 with the purpose of limiting development and preserving the bucolic character of the Town. Today, most of the parcels in central Woodside are a minimum of three acres. Horses are a common sight, and there are several equestrian facilities, as well as miles of trails.
2025 in Review | Woodside
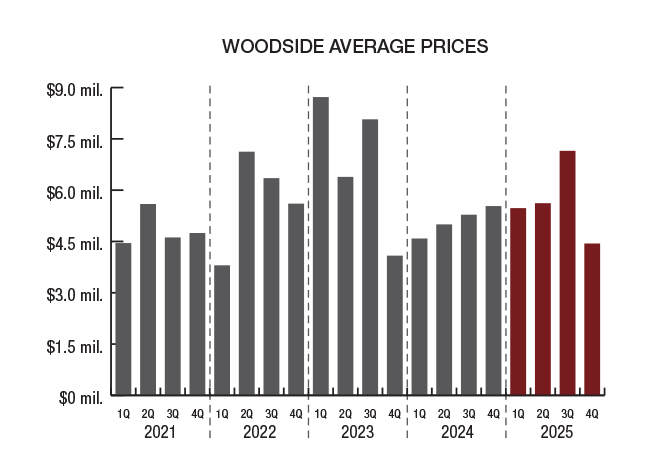
The average sale price in Woodside was $5,863,539, which represented a 15% increase compared to 2024. It is important to note that an $85 million sale in 2025 contributed to this increase. Prices by quarter varied throughout the year. In the first quarter it was $5,474,050, in the second quarter it was $5,617,987, then it was $7,150,109 in the third quarter, and then completed the year at $4,440,607 in the fourth quarter.
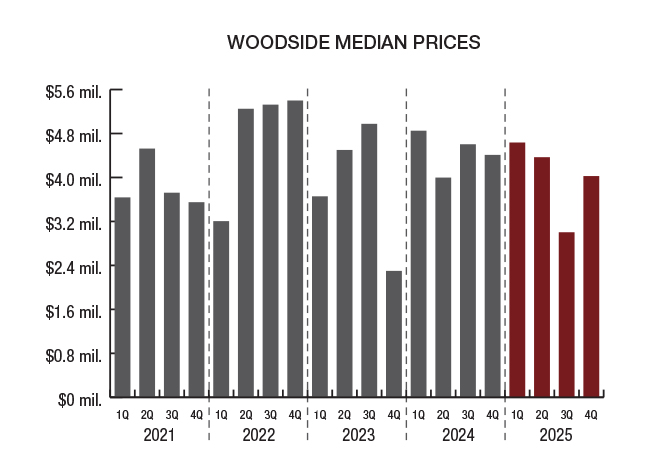
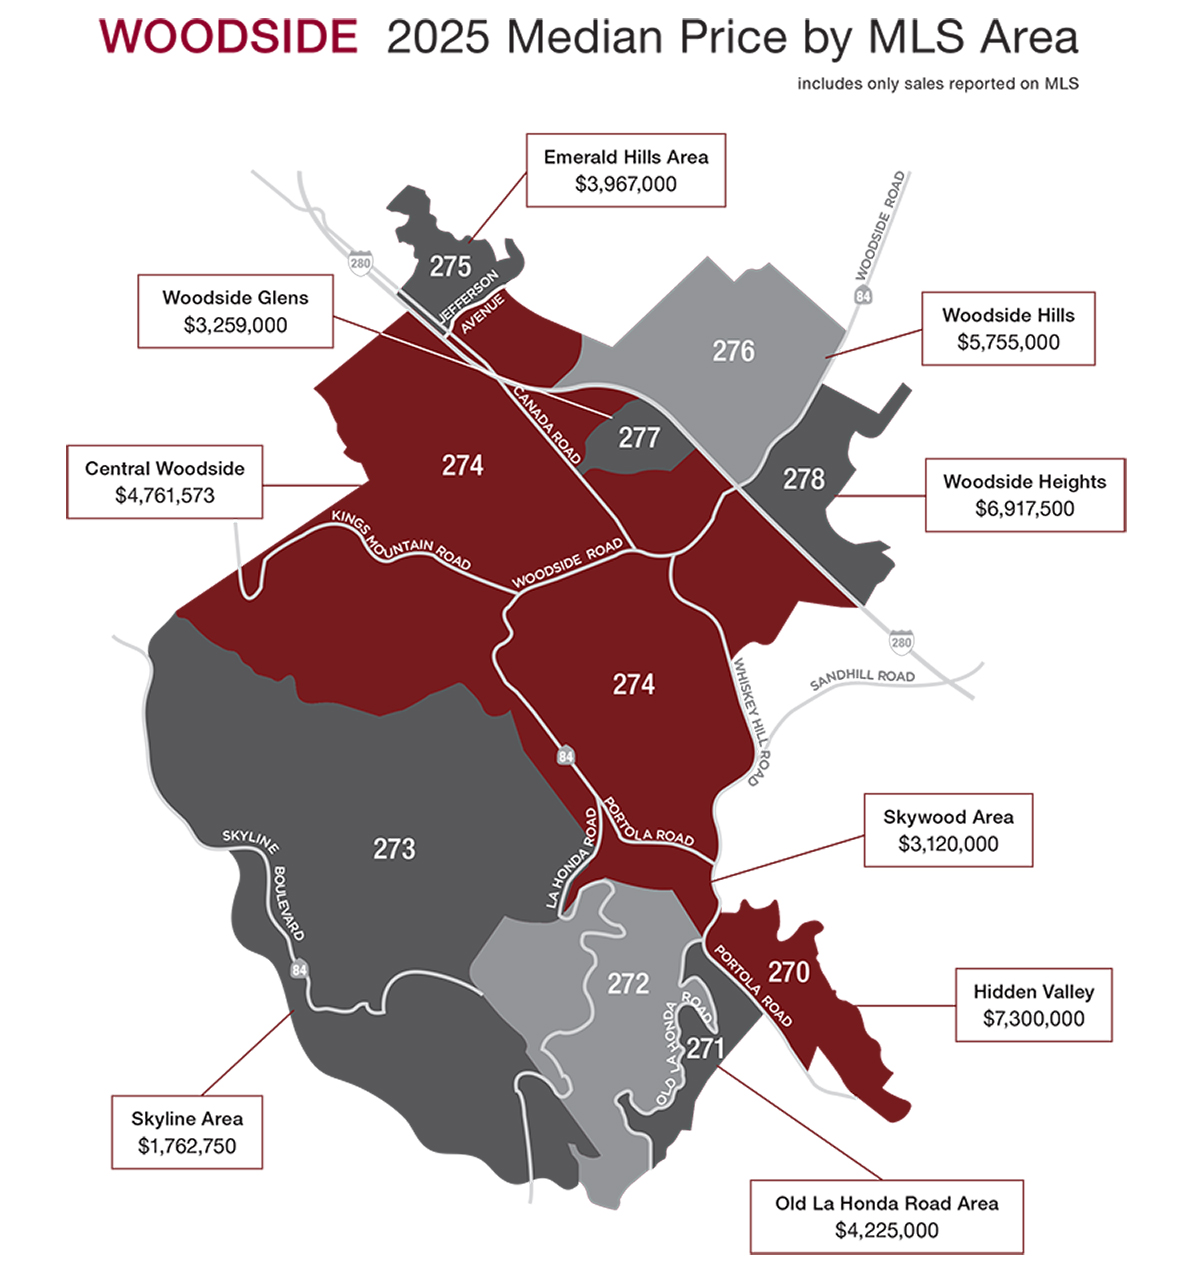
On the other hand, the median price declined 7% to $3,935,000, and the first time below $4 million since 2021. The median price was the highest at $4,635,645 in the first quarter, $4,367,500 in the second quarter, then $3,002,500 in the third quarter, and $4,024,500 in the fourth quarter.
The highest end of the market saw 8 homes that sold for more than $10 million on the MLS, compared to 7 in 2024. The highest priced sale on the MLS was $85,000,000. Of these 8 sales, there was 1 in the first quarter, 5 in the second quarter, 2 were in the third quarter, and none were in the fourth quarter.
There were 14 homes, or 19%, that sold for more than list price compared to 32% in 2024. Another 10 homes sold for list price and 51 homes, or 68%, sold for less than list price.
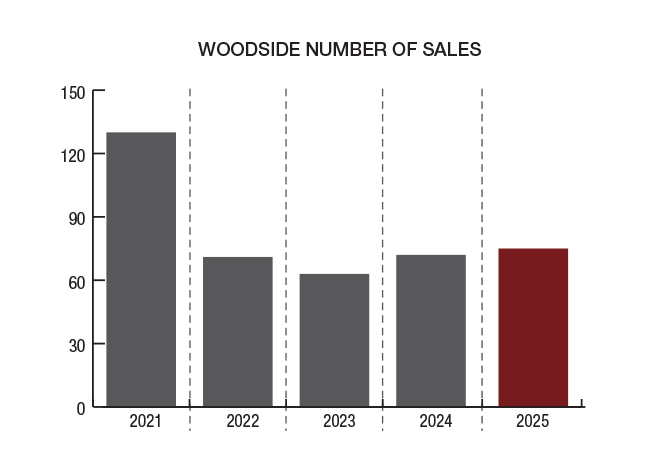
The number of sales, at 75, was up 4% compared to 2024. There were 13 sales in the first quarter, 24 in the second quarter, 24 in the third quarter, and 14 in the fourth quarter. Keep in mind that any Woodside properties sold off-MLS are not part of this review.
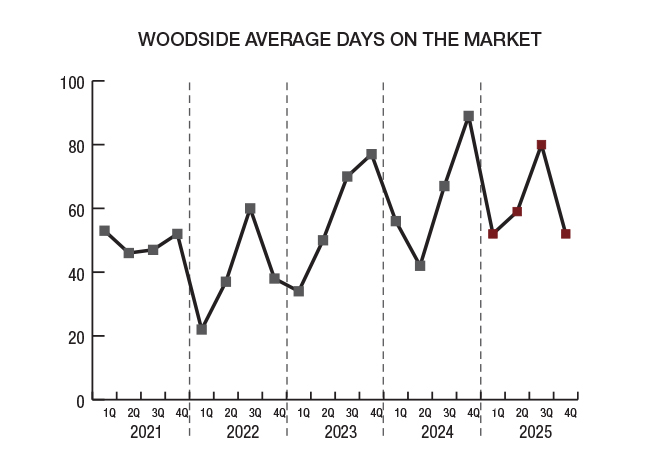
Homes took just about the same length of time to sell in 2025 with an average days on market of 63 compared to 62 in 2024. Pricing was still key to how long a home was on the market. This direct correlation is seen with homes that sold for list price or more, which were on the market an average of just 25 days; homes that sold for less than list price were on the market for an average of 80 days.
Important Woodside Phone Numbers
| Police Non-emergency | 650•364•1811 |
| Fire Non-emergency | 650•851•1594 |
| Building/Planning | 650•851•6790 |
| Caltrain | 800•660•4287 |
| City Office | 650•851•6790 |
| Library | 650•851•0147 |
| Post Office | 650•368•4163 |
| Voter Registration | 800•345•8683 |
School Websites and Phone Numbers
| Woodside School District | 650•851•1571 |
| Las Lomitas School District | 650•854•2880 |
| Redwood City Elementary School | 650•482•2200 |
| Sequoia Union High School District | 650•369•1411 |


