REAL ESTATE REVIEW
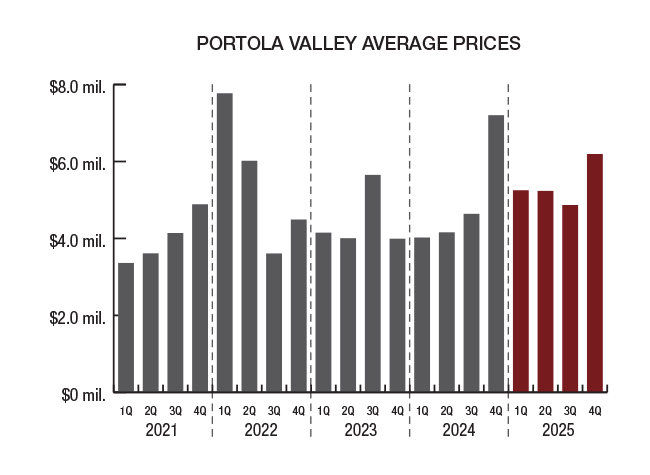
The average sale price in Portola Valley was a record high at $5,573,720. This represents a 13% increase 16 compared to 2024, and only the second time it has exceeded $5 million. As the year went on, the average price fluctuated each quarter and then escalated at the end of the year. In the first quarter it was $5,252,077, in the second quarter it was $5,236,333, in the third quarter it was $4,868,889, and then it reached its high of $6,194,458 in the fourth quarter with the sale of one home for $56 million
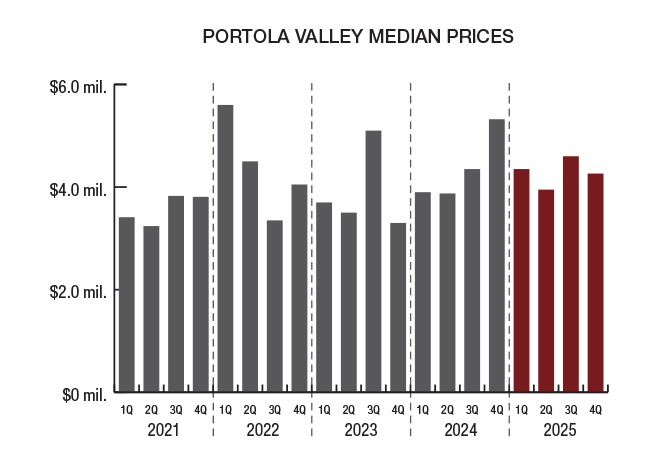
The median sale price of $4,250,000 represented a 4% increase compared to 2024, and was also a record high. The median price was $4,350,000 in the first quarter, then dropped to $3,950,000 in the second quarter, increased to its highest at $4,600,000 in the third quarter, and then dropped again to $4,262,500 in the fourth quarter.
There were 3 sales for more than $12 million on the MLS, including one at $25 million and one at $56 million. There were 12 homes that sold for $7 million or more, the same number as in 2024
There were 37 homes, or 49%, that sold for more than list price. This compares to 29 in 2024. 9 homes sold for list price and 30 homes, or 39%, sold for less than list price.
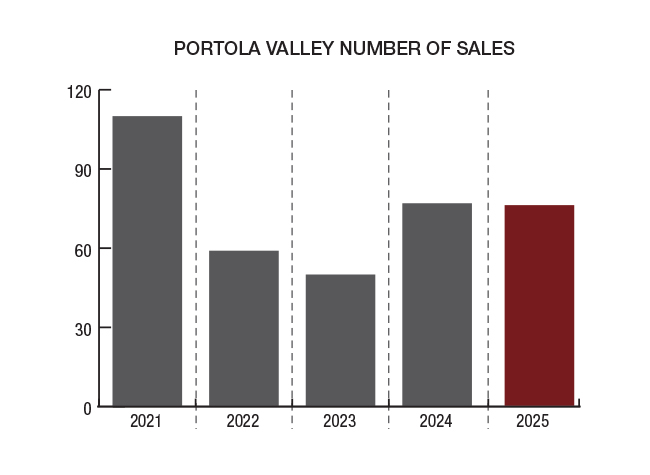
The number of closed escrows in Portola Valley dropped by 1 to 76 sales in 2025 compared to 77 in 2024. There were 13 sales in the first quarter, 24 sales in the second quarter, 9 sales in the third quarter, and 30 sales in the fourth quarter. Keep in mind that any Portola Valley properties sold off-MLS are not part of this review.
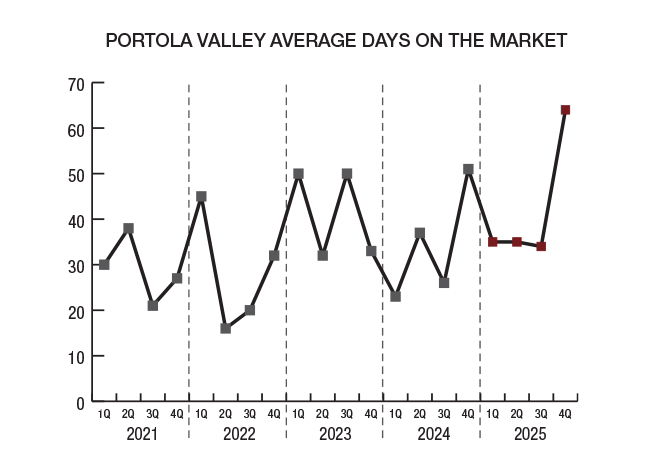
The average days on market, at 46, was a 39% increase compared to 2024. Pricing was still key to how long a home was on the market. This direct correlation is seen with homes that sold for list price or more, which were on the market an average of 15 days; homes that sold for less than list price were on the market for an average of 94 days.


